Let’s be honest: Excel’s never-ending rows and columns of data can be very depressing. However, what if I told you that there is a method to turn this data into breathtaking visualizations and interactive dashboards that will impress your coworkers and elevate you to the position of office hero?
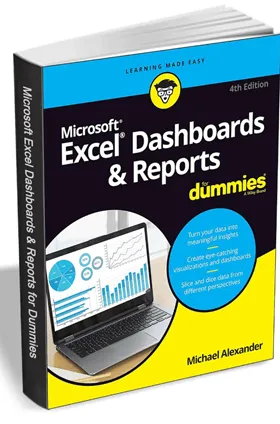
Download Free Excel Dashboards & Reports For Dummies ebook & learn to create stunning visuals & interactive dashboards to impress your boss & become a data analysis pro!
Yes you can get Excel Dashboards & Reports For Dummies, 4th Edition, for free for a short time only. This is a great deal, since it normally costs $24.00.
The masterful Michael Alexander’s new edition delves into Excel’s inner workings, offering more than just instructions. This book immerses readers into the world of crafting visually captivating dashboards that transform boring rows and columns of data into interesting stories.
About Excel Dashboards & Reports For Dummies eBook (4th Edition) :
Unlike the typical “Excel for Dummies” guide, this one goes above and beyond. If you want to take your data analysis to the next level, you need to learn how to unlock Excel’s true power.
Here’s what you’ll learn:
- Create eye-catching graphs and charts. Forget the boring bar charts. Master the skill of making interactive charts that graphically present data in a way that draws attention to trends, comparisons, and discoveries.
- Construct engaging dashboards—no more dull reports! Find out how to make dynamic dashboards that let users see relevant information quickly, filter data for more in-depth research, and dig deeper for more detailed results.
- Formulas and Functions in Excel: How to Make Them Work for You. You don’t need a math degree! This book breaks down even hard numbers into steps that are easy to understand.
- Learn how to save your work in readable formats that are ideal for report writing and presentations.
This dummies ebook will walk you through the steps of using Excel’s features to create and oversee more effective reporting systems. Building high-quality reporting components, whether for dashboards or reports, is a breeze with the help of this book, which thoroughly explores analytical and technical topics in every chapter.

Please keep in mind that this book is not a guide to the best ways to use graphics or dashboards. The focus of this book is on the technical side of using Excel’s different tools and features for reports.
By the end of this book, you will know how to take that static data and turn it into interactive dashboards, visualizations, and reports.
How to Get Your Free Copy
Follow these steps to get your free copy of Excel Dashboards and Reports for Dummies:
- Go to this promotion page.
- Type in your email address, then click “Download.” You can make a free account on TradePub if you are new to the site.
- Once you get the confirmation email, click the link in it to get your free copy.
- Take advantage of this offer before May 14th.
